
How to choose your performance indicators? How many? How to set them up? In what form? How often should they be updated? An effective indicator provides, at a glance, useful information on where the team is in achieving its objectives. It is better to have a few precise indicators adapted to your organization, than a complete but ultimately unusable dashboard.

Any structure or organization uses indicators to measure its performance. They guide day-to-day decisions. Moreover, whether you are in a non-profit association, a cooperative, a small or large company, accountability is necessary for the board of directors, the members or the shareholders.
Setting a goal often results in a deep and abrupt takeover.
Walter Disney (1901 – 1966), American film producer
The scope of the indicators extends to the entire company. It is then broken down by departments, services and even individuals. This is where the indicators show their power: they put us into action!
Clarify your performance model
It is essential that the indicators are aligned with the company’s performance model. A classic mistake is to select indicators from a pre-made list. First of all, we need to ask the following question: what are the factors that impact our results?
From the answers, it becomes easy to build sets of key indicators, taking care not to multiply them. A large number of indicators is inefficient. On the one hand, instead of taking action, your teams will spend time updating them. On the other hand, you will increase the complexity of your organization. How will you prioritize your actions? What indicators will you need to act on to get the best results?
To fully understand, you can consult the example of a Customer Contact Center. The key indicator is a combination of call volume and processing time. Secondary indicators will be satisfaction rate, first contact resolution and employee engagement.
Start building with the 5W’s
Once you have clarified your performance model, you can specify a certain amount of information for each indicator. The 5W’s is the perfect tool to do this.
- Why did I choose this indicator?
- What does it measure?
- Who updates it?
- Who has the information to update it?
- What is its purpose?
- Who wants to see it?
- What will be the format (handwritten, printed, computerized)?
- Where will I put it (network directory, office entrance…)?
- When will I update it (day, week, month, year)?
- When do I start it?
- How do I update it?
All of these questions should clarify the role and use of the indicator. An indicator that you would like to update every week, on sales for example, but that takes you 3 hours of data compilation with Excel to get the result is not efficient. Either the information chosen for the indicator is not the right one, or there is a lot of room for improvement in your processes!
Some tips for effective indicators
An indicator is used to measure your performance, not to deteriorate it. Therefore, the number must be reduced and the update must be effective.
Understandable and actionable indicators
The indicators must be clear. An indicator that requires 10 minutes of explanation is not a good indicator. So, at a glance, one should know how the company is doing.
Your indicators should help you know that you are on the wrong road. The earlier you detect it, the better you will be. Each indicator should lead to actions. If you see performance deteriorating, but don’t know what to do about it, your indicator is reactive.
Making indicators accountable
Ideally, indicators should be reported in the field and by the teams that produce them. Team managers will then be able to record data to track trends and trace history, and set goals.
However, who is accountable for the action plans? If the indicator deteriorates, who reacts? Who should implement and monitor the action plan?
In a directive model, it will probably be the managers. The reactivity will then be less, but the actions may be more concerted with other sectors. In a participatory model, the person who produces and completes the indicator takes action to correct it when necessary. She informs management and asks for support when needed.
Keep it simple
To be effective, there is no need for digital tablets and dynamic graphics. Sheets with pre-printed graphics are an easy way. Everyone can come and add a dot or a cross according to what they have got as a result.
However, technology, when used, must facilitate data collection. For example, digital tools are very well suited when teams are on different sites or when operators are already using computers. IT development teams, on the other hand, have their noses in their screens all day long. The question then arises: digital or physical indicator? If the team is located in the same place, forcing members to get up to document can improve performance. It will reduce time spent behind the computer for too long.
Dare to use color, but not too much
Colors bring joy to the office. However, try to resist your overly artistic impulses. The classic green/yellow/red is a standard. You should respect it for the sake of everyone.
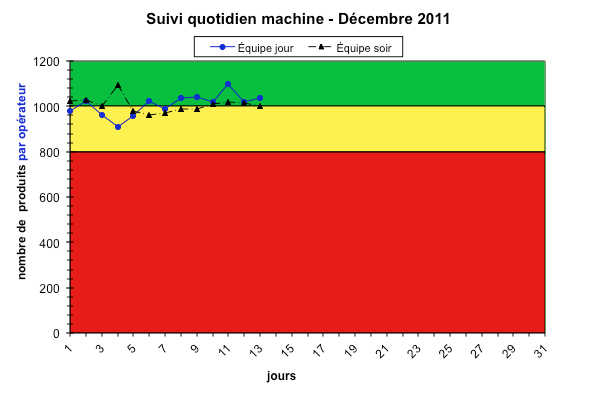
Some organizations adopt a binary code: green and red. Indeed, often nobody dares to put red, symbol of problem. So, we end up with a pseudo binary code: red / yellow / green, but with only yellow and green used.
Take the time to clearly define what falls under each color and your indicators will be more consistent.